
Quiet Zone Spherical Near-Field Scanning
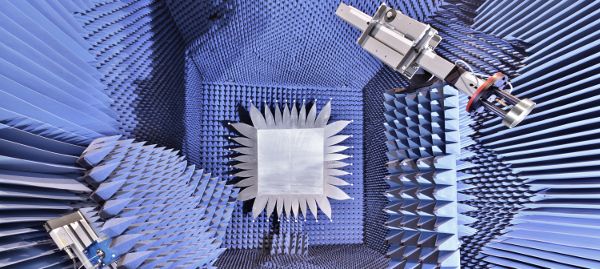
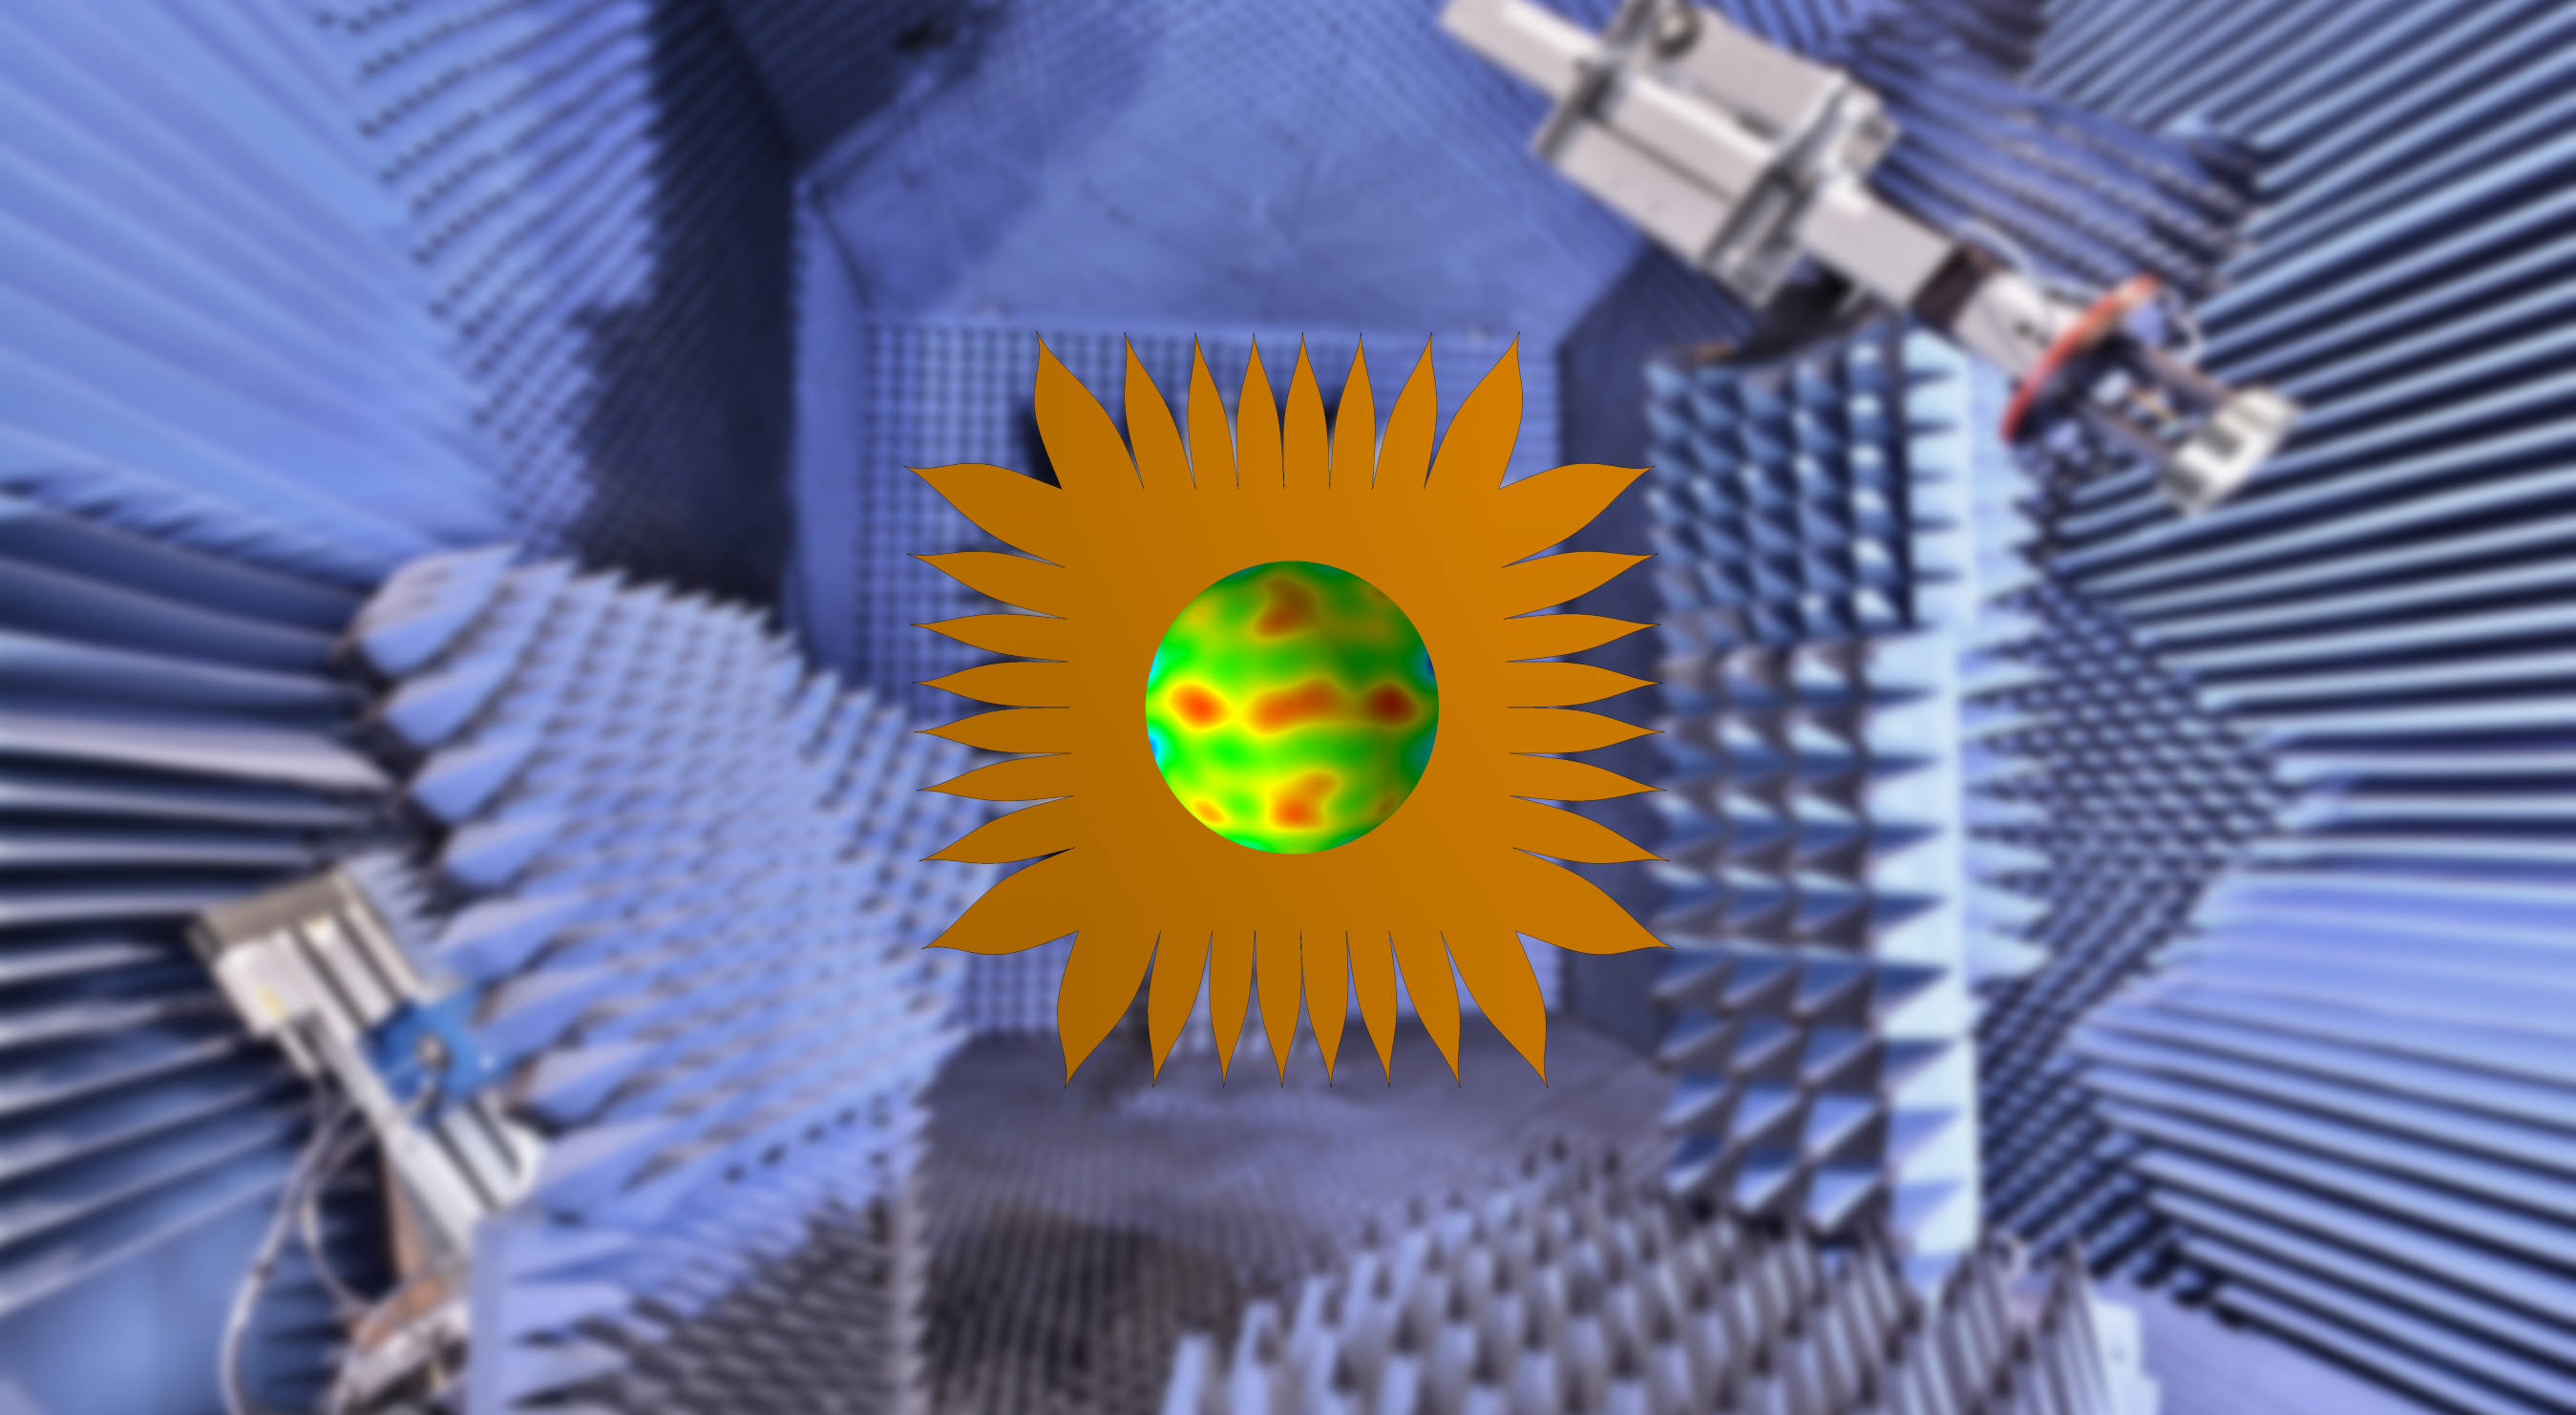
In Quiet Zone Spherical Near-Field Scanning (QZSNFS) the electric field is sampled on the surface of a sphere surrounding the Quiet Zone (QZ) which is further called the measurement surface. The sampling can be achieved by adding a sturdy beam on top of the available positioning system in an antenna measurement chamber. Figure 1 shows such a measurement setup using a roll-over-azimuth positioning system which is installed in the Compact Antenna Test Range (CATR) of the institute. In this case, it should be noted that the coordinate system of the measurement surface no longer coincides with the coordinate system which is used for antenna measurements. While in a standard measurement setup, the z-axis points towards the reflector in a CATR, the new z-axis points along the azimuth rotational axis for the QZSNFS setup, effectively exchanging the θ and φ axis in the range. On the left-hand side, the feed antenna (partly hidden by the absorber baffle) is shown, in the center, the reflector and on the right-hand side, the tower on which the Antenna Under Test (AUT) is normally mounted. On top of the AUT positioner a fiberglass (gray) beam is mounted which is used to move the probe on a spherical surface around the QZ. The probe is specially designed for this purpose.
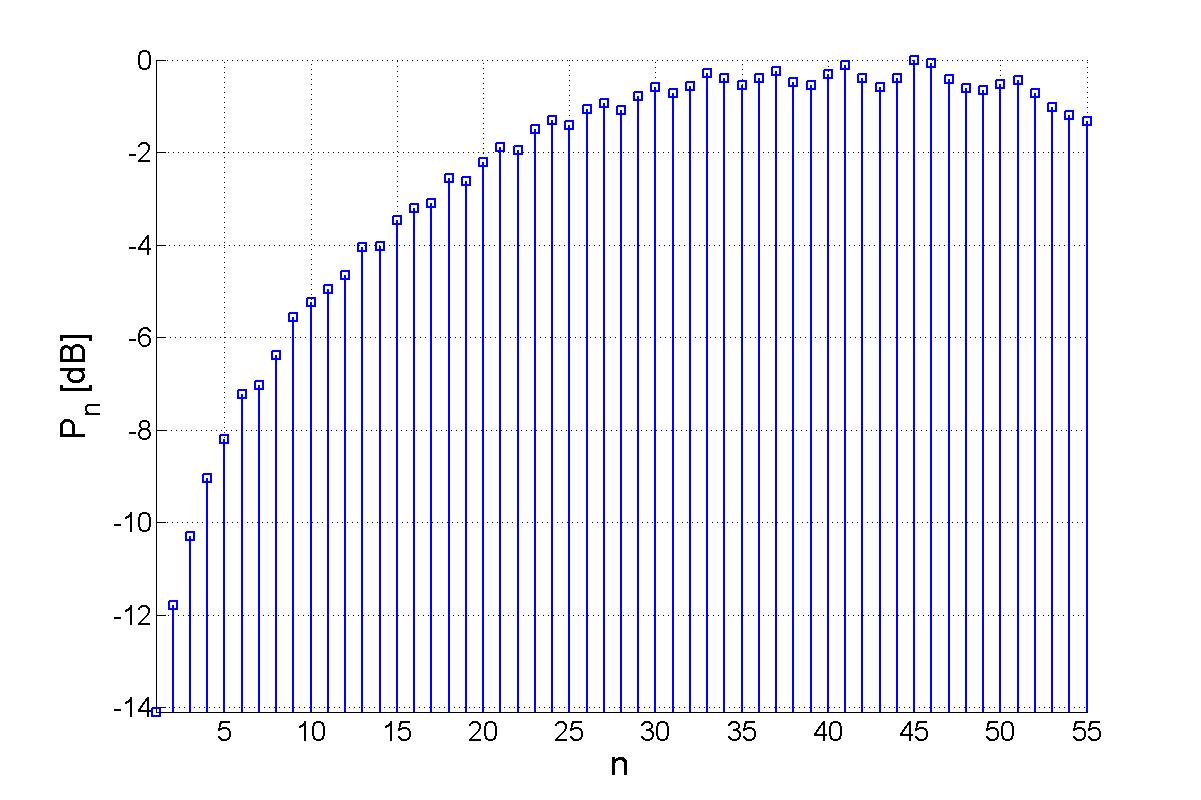
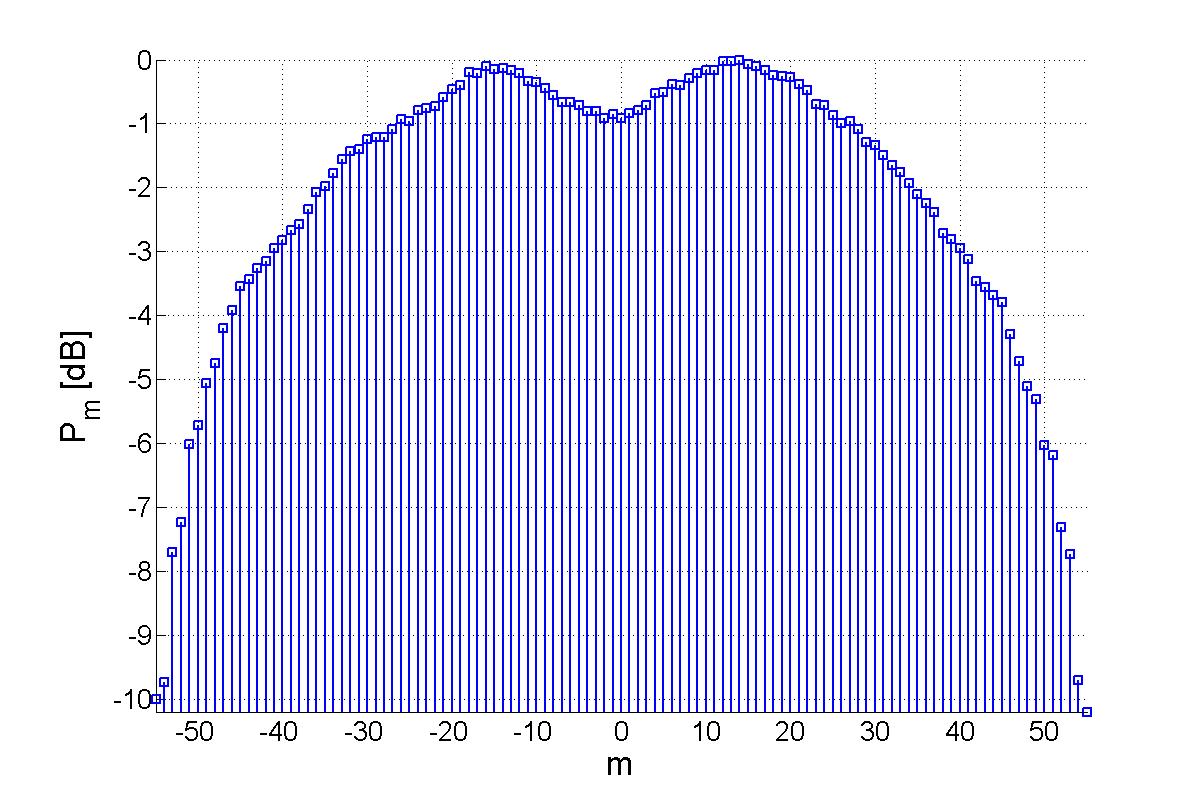
After the measurements have been performed, the Spherical Wave Expansion (SWE) is applied where the field is decomposed into spherical modes. The SWE for QZSNFS is similar to the near-field-to-far-field transformation which is used in conventional spherical near-field antenna measurements. The only difference is the inversion of the signal direction. Figures 2 and 3 show the calculated mode spectra of the quiet zone at a frequency of 2.5 GHz.

Combining Mode Rotation With CLEAN
The Combining Mode Rotation with the CLEAN (CMRCLEAN) algorithm is based on the fact that far-field sources which propagate along the z-axis concentrate all of their power in the m=±1 modal spectrum. This is due to the fact that the associated Legendre function of the first kind is only nonzero for these m-modes. If the source is not aligned, the power is spread over all m-indices depending on its direction in θ and φ.
The calculated mode spectrum is the so-called Dirty Map (DM) which contains a convolution of all the reflective sources including the main signal. In order to find a far-field source, the mode spectrum needs to be rotated such that the direction of the source is aligned with the z-axis. This can be achieved by using Euler's xyz-rotation functions with which it is possible to express a spherical vector wave function in a rotated coordinate system as a combination of spherical vector waves in the unrotated coordinate system. The rotations can also be applied directly on the mode coefficients Qsmn by
For each rotation over the angles θ and φ, a sum is created over the modes with modal indices m = ±1 and stored in a detection map. If there are any large sources, these sources tend to overshadow the smaller sources and need to be removed from the DM before the smaller ones can be detected. For this purpose, the CLEAN algorithm is used. When a far-field source has been detected, it can be removed from the DM and inserted into the so-called clean map.
The direction of an incident wave coincides with the z-axis twice in total, once when entering the QZ and once when leaving. The incident direction can be determined by comparing the signal strength. This has the advantage that only one hemisphere of rotations needs to be calculated to find each of the sources, reducing the computation time. By projecting the detected source onto the surface of the QZ for the angular direction of the source (θ and φ), both tangential components Eθ and Eφ can be derived. The separation in the tangential field components adds important information about the polarization of both the main signal and the scattering sources in the chamber.
After rotating the DM in such a way that the detected source is aligned with the z-axis again, the power of the far-field source is calculated and removed. In effect, the signal power is removed but the phase information is kept for the detection of other sources. After removal, the DM is rotated back to the original coordinate system and used for the next iteration. It should be noted here that the algorithm is not able to detect standing wave issues since the power of the two oppositely directed traveling waves decreases to the same extent.
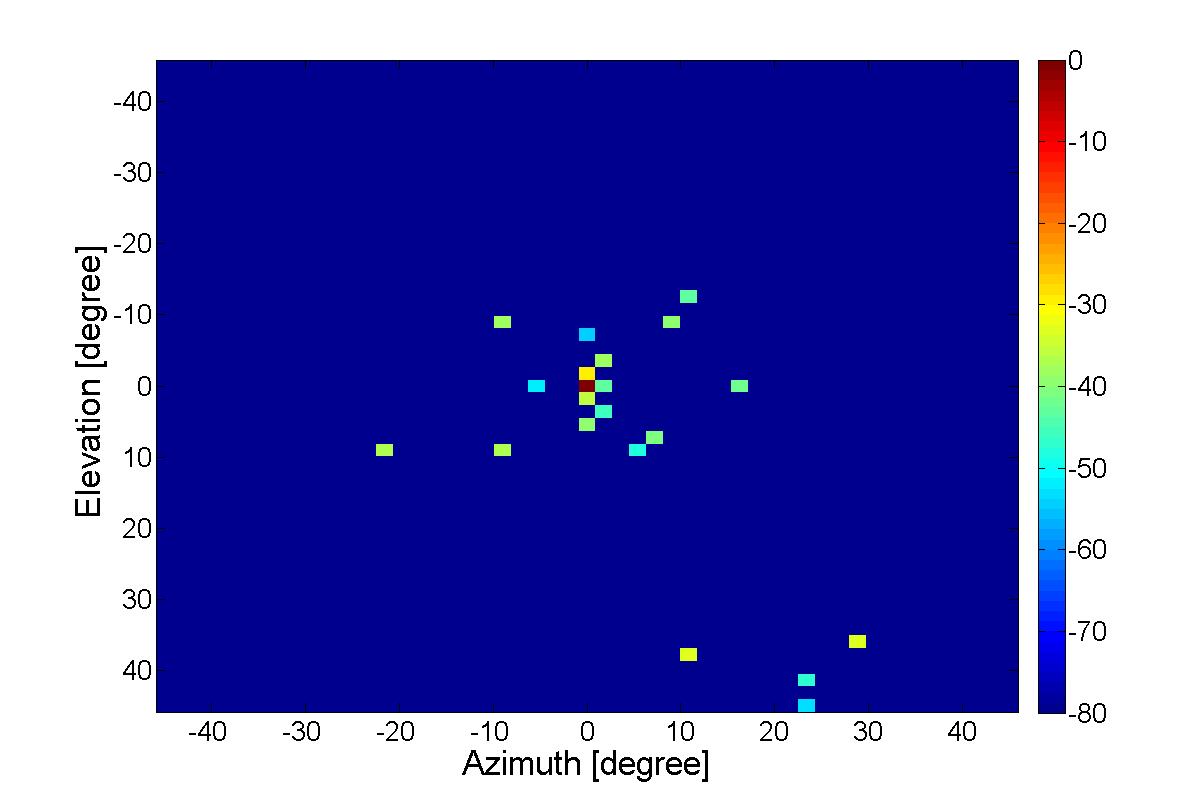
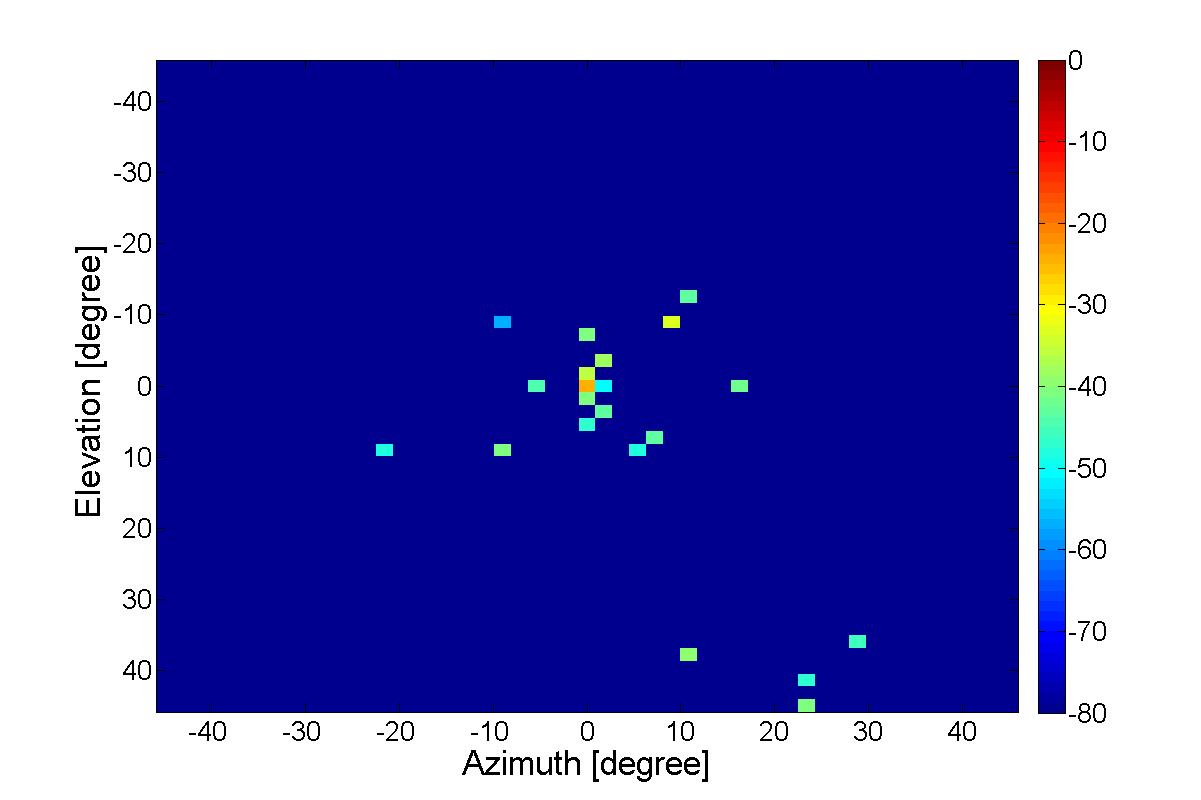
Figures 4 and 5 show the sources which are detected using the CMRCLEAN algorithm. The source power is normalized to the main beam for the vertical polarization. Having both tangential components separated gives important extra information about the polarization of the main beam and depolarization of the scattering centers along the CATR reflector. It is pointed out here that the resolution of the signal detection in this algorithm is much higher than the one of planar fieldprobing.

Calculating Linear Probing Data from QZSNFS Measurements
During measurement chamber validation and quality assurance, it can be beneficial to view probing data on linear cuts or planes through the QZ such as usually measured using fieldprobing. Since the QZSNFS provides a complete description of the electromagnetic field distribution in the QZ, the linear probing data can easily be calculated from the mode spectrum. If, furthermore, the transmission formula is adapted for calculating the output of a virtual probe antenna at arbitrary locations inside the QZ, the output is consistent with actual fieldprobing measurements.
The adapted transmission formula is given as:
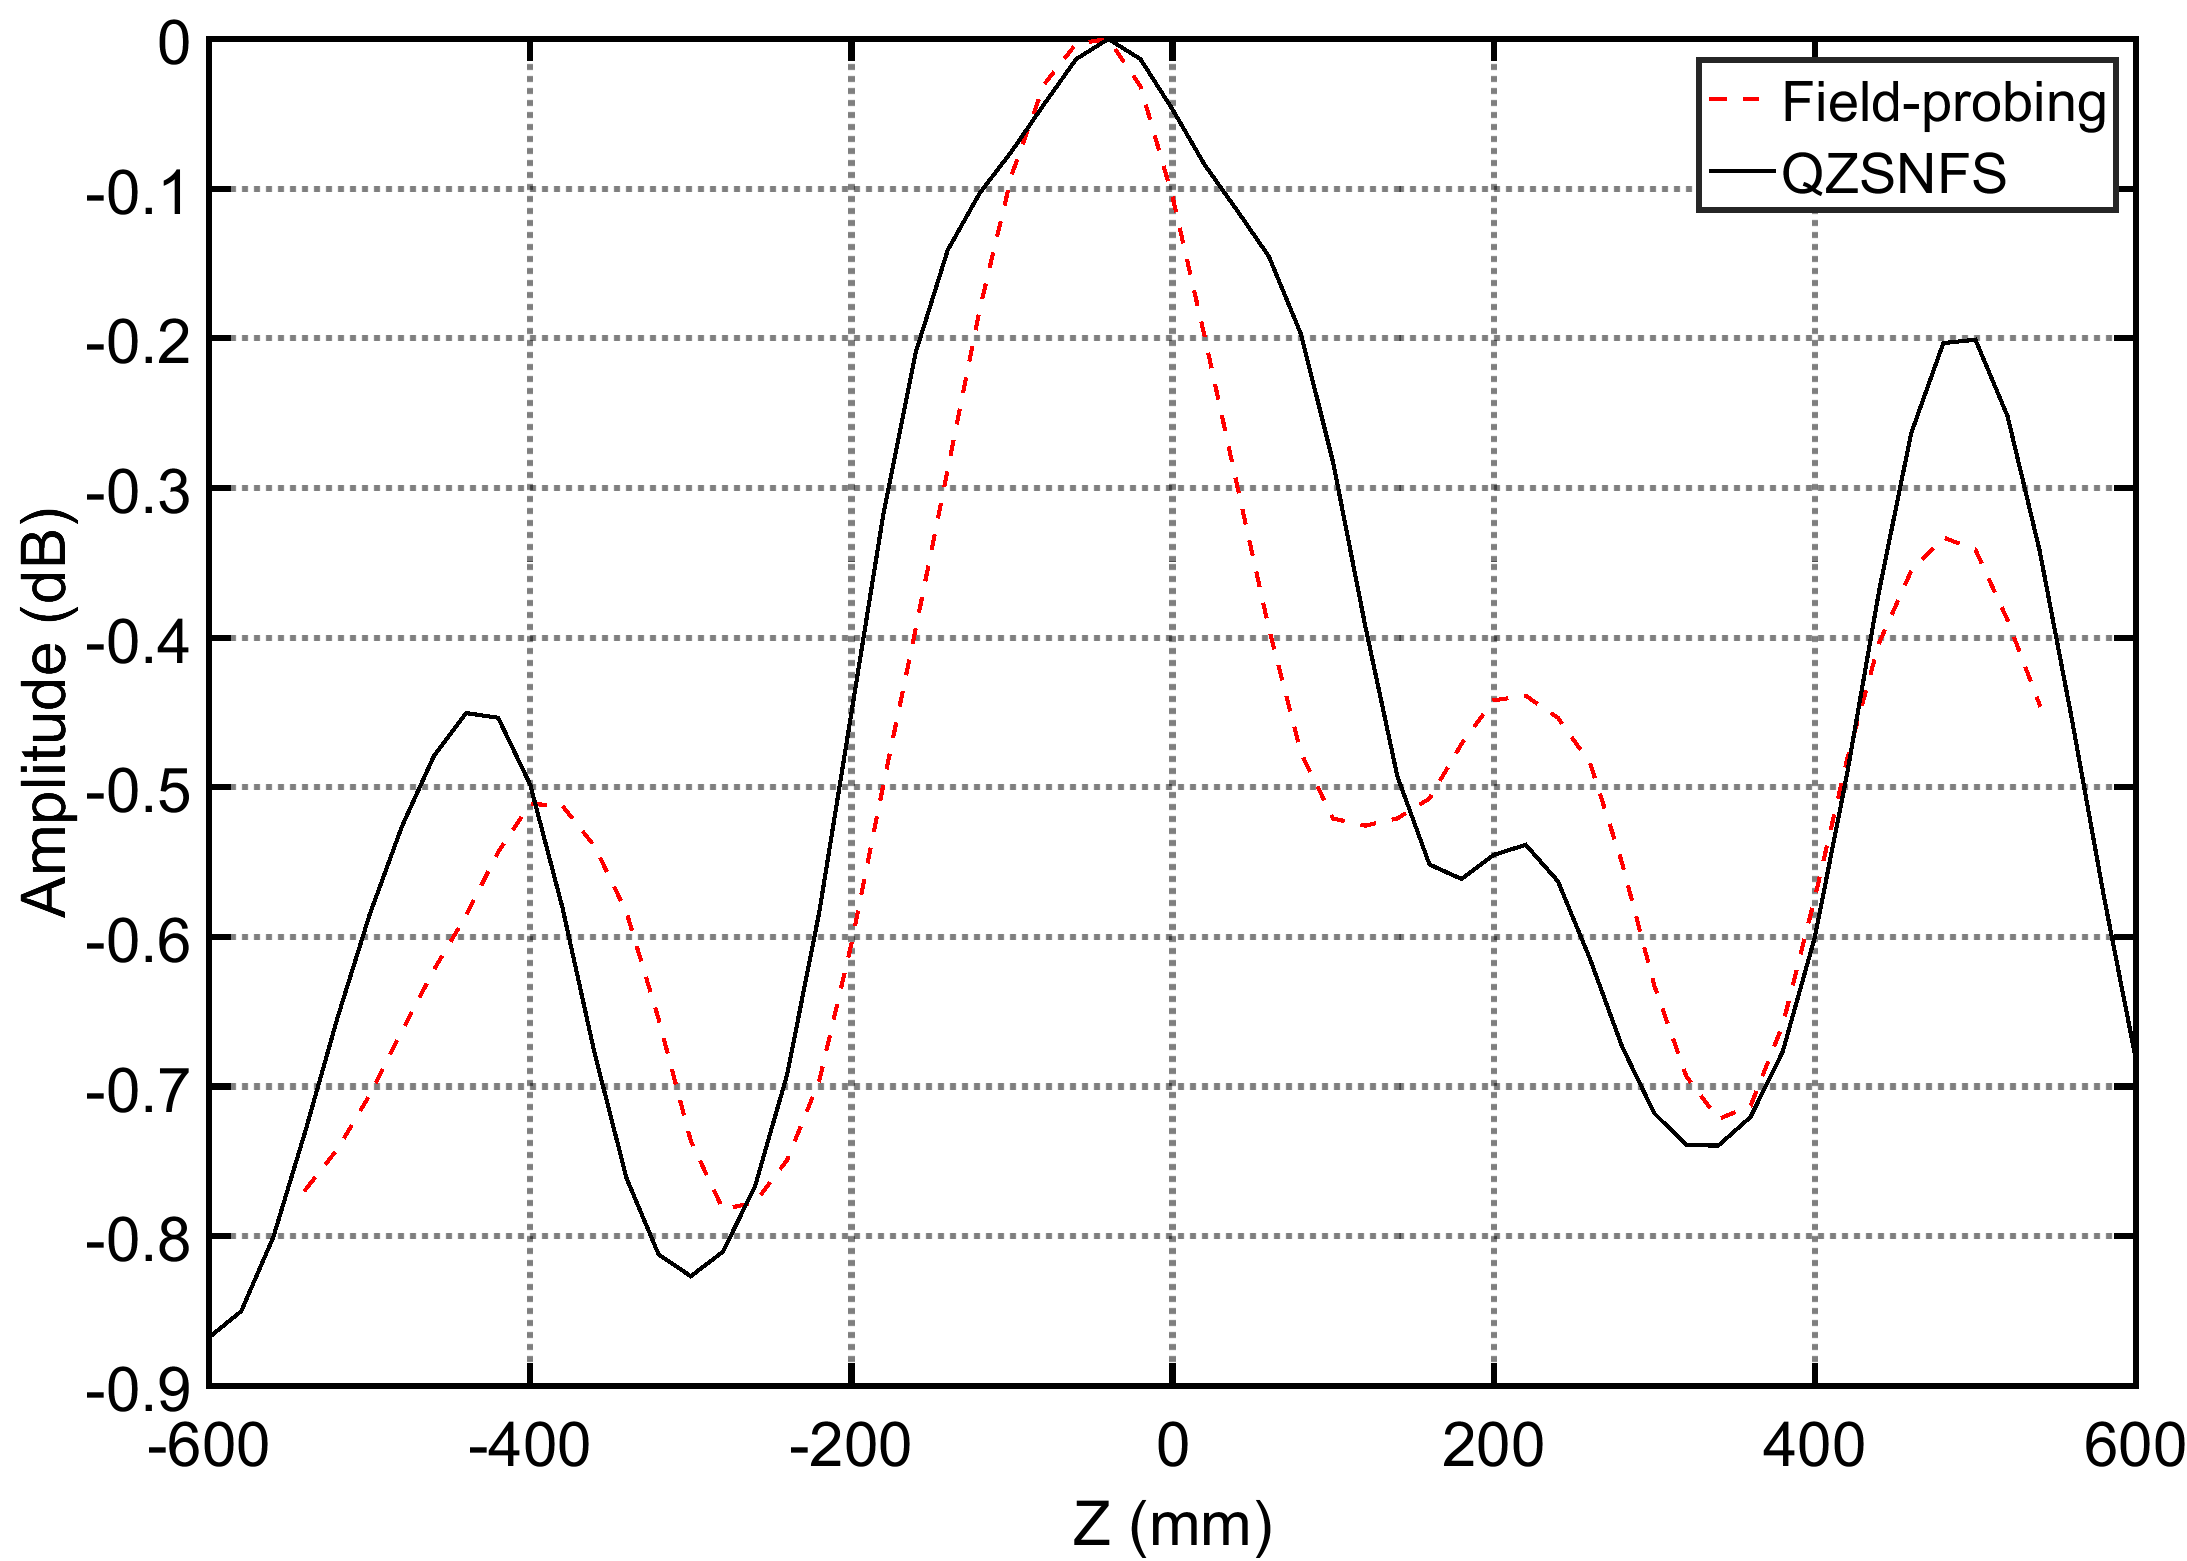
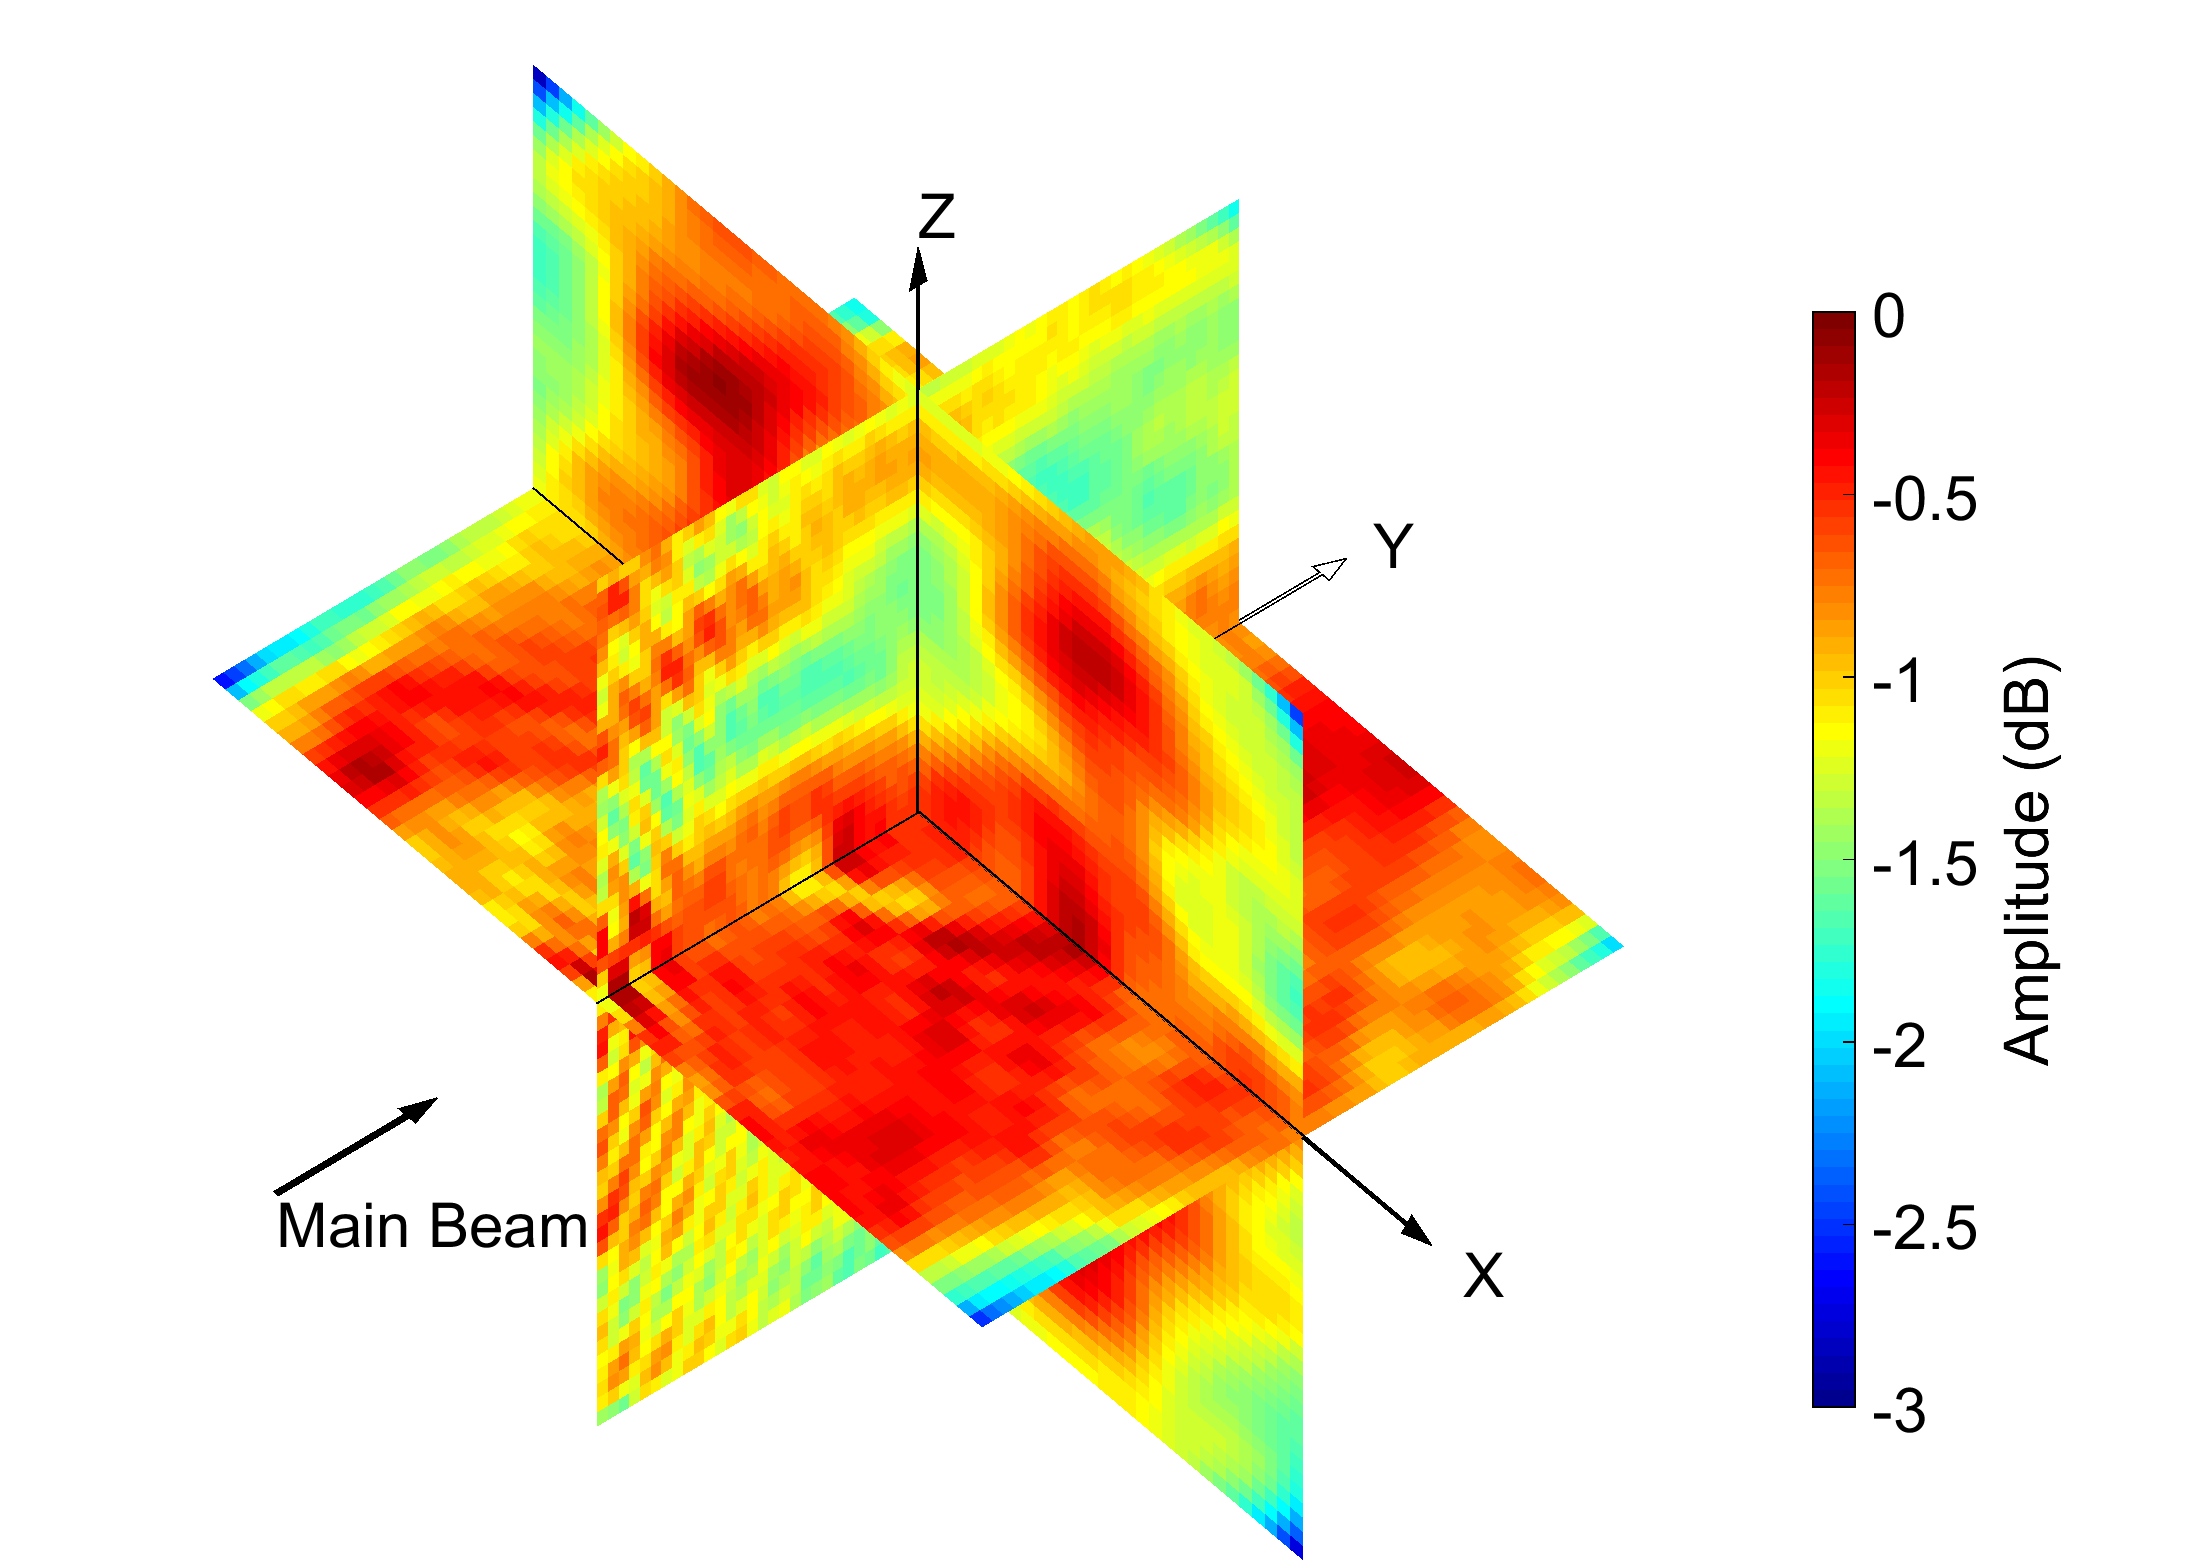
where C is the translation function in arbitrary direction (Bruning and Lo 1969) and R are the rotated probe coefficients. In Figure 6, a comparison is shown between planar fieldprobing measurements (red) and calculated values from QZSNFS. In Figure 7, three planes have been defined on which the output signal of the probe is calculated. The output enables a good visual estimation of the amplitude distribution in the QZ.
Combination with numerical methods
An important aspect in QZSNFS is the investigation of the measurement accuracy. Using numerical methods and a simulation model of the measurement chamber (Figure 8), a comprehensive sensitivity analysis can be performed. By using complex simulation scenarios and introducing certain errors, such as misalignment of the feed antenna, undesired effects within the measurement chamber can be predicted and their impact on the electromagnetic field in the QZ can be investigated. Through the powerful combination with simulation methods, it is therefore possible to fully evaluate the spherical measurement system.